Monthly Archives: September 2013

2013 Top Innovative Firms

BCG released their 2013 Most Innovative Companies survey results and their list of the top 50 firms (registration required to access). Focus is on large multinational brands. Several of the main observations.

Five Key Attributes of Innovation Leaders

The survey identifies five key attributes that the leading innovative companies adopt noting that strong firms adopt all five. The five key attributes are:

  1. Top management commitment to innovation as a competitive advantage.
  2. Firms leverage their IP in both defensive and offensively to strengthen their competitive advantage.
  3. Firms effectively manage a portfolio of innovative initiatives.
  4. Firms have strong customer focus.
  5. Firms insist on strong innovation processes that leads to strong performance.

Transportation Industries

The report observed the advancement of many of the leading automotive firms in the rankings as the firms strive for higher fuel efficiency, higher safety standards, and mobile device integration. Notably aircraft and aircraft engine innovators who are also striving for higher fuel efficiency in air transportation were not mentioned. Although Boeing and GE makes the list at #13 and #32 respectively Airbus and Pratt & Whitney do not make the list.

Canadian Industries

There are no leading Canadian brands on the list although several top 50 firms access Canadian knowledge talent with branch plant operations for example – Google (#3), IBM (#6), GE (#10), P&G (#23), and Shell (#26). Canada’s weak product development mindset and poor independent innovation performance remain underlying problems. Shell and ExxonMobil were the only energy leaders making the list.

Key Innovation Performance Trends

Several key innovation performance trends were observed:

  1. 85% of strong innovators expect to spend more on innovation and new product development than last year.
  2. Leaders are focusing and making smarter investments.
  3. Fewer firms reported changing directions once started.
  4. Firms are improving their innovation process performance.
  5. Judgment of senior management for determining which ideas to move to product development was adopted by two thirds of firms.
  6. Strong innovators listen to customers.
  7. The importance of firms leveraging their IP for competitive advantage was growing.

How SMEs Can Better Withstand Market Uncertainty

Markets today are experiencing higher levels of volatility, uncertainty, complexity, and ambiguity or VUCA. A market VUCA crisis arises when a threat emerges from the uncertainty that directly impacts a firm’s survival. SMEs (firms less than 500 employees) are more susceptible to a VUCA crisis in the market place than larger firms that possess the ability to absorb more shock. Most literature use case studies of large firms. As SMEs survive and scale management must also still be concerned about how to withstand a VUCA crisis impacting the firm’s business model and value proposition.

A key question then is How can SME management ensure their firms are more resilient in the presence of market VUCA?

Uncertainty Management Assessment

Syrett and Devine recently devised a framework to assess the readiness of a firm to manage uncertainty in their book Managing Uncertainty: Strategies For Surviving and Thriving in Turbulent Times. Six components of uncertainty management are proposed:

  1. Strategic Anticipation – The capability to determine and the ability to implement a strategy that is highly responsive to an unpredictable and potentially volatile environment.
  2. Navigational Leadership – The capability to instill a collective sense of where the organization is and the confidence and optimism to move forward into an uncertain future.
  3. Agility – The capability to move rapidly and flexibly in order to shape or adapt to the threats and opportunities arising from uncertainty.
  4. Resilience – The capability to absorb and positively build on adversity, shocks, and setbacks.
  5. Open Collaboration – The capability to dissolve boundaries, forge links, and reach outside through partnerships and the sharing of ideas and information to gain a broader perspective and maximise innovation.
  6. Predictive Learning – The capability to sense, probe, and analyze previously hidden patterns and trends in order to anticipate sudden or disruptive change.

Assessing the firm against each of the components of the framework enables management to determine the firm’s readiness to prepare for market VUCA crises, mitigate downsides, and exploit upside opportunities. This framework can be integrated with a firm’s strategic planning & execution process and applies some of same uncertainty management techniques that can be applied to projects and innovation.

SME vs Large Firms

Using Syrett & Devine’s uncertainty management framework some of the leading approaches that are more appropriate for SMEs are worth identifying. Of the six components agility and absorption are the core approaches firm’s have traditionally adopted to survive a market VUCA crisis. Large firms possess greater absorption capabilities with less agility due to their size whereas SMEs on the other hand can exploit agility to compensate for their lack of absorption capabilities. The mix of agility and absorption available to management depends on where the firm is positioned on the growth cycle as shown below:

Firm Agility Absorption

Beyond agility and absorption the other four components are useful to facilitate a more proactive approach to prepare for a unpredictable market VUCA crisis giving more safety margin rather than a panic reaction to a sudden surprise.

Some of the inherent characteristics of the SME though should also be considered because they can both help and harm how these uncertainty management approaches can be exploited by SMEs. The most relevant SME characteristics include:

  • Inherent agility arising from the smaller size of the firm (as mentioned already).
  • Closely related to agility is the fact that managers and staff tend to be more geographically close enabling faster communications and rapid response.
  • A culture of driving the business by personal relationships (of the owner/founder) rather than professional management.
  • Cost consciousness arising from the tight resource constraints in SMEs.
  • Higher level of risk taking particularly in the earlier stages but diminishes as firm’s grow.
  • Centralized decision making by the owner with a greater coincidence of power between the owner and manager roles.
  • Owner has a direct impact on day-to-day operations.
  • Owner and small management group are often multi-hatted in their management roles and juggling multiple priorities.
  • Owner’s decision making is based on a commercial orientation although may be influenced by personal preferences, desire for lifestyle, and community reputation.
  • The owner may have a lack of ambition to grow and may just give up if the market VUCA crisis is severe enough – this discussion is more oriented towards SMEs that have the potential to grow much larger as opposed to local businesses.
  • Informality and lack of written procedures.
  • Differences between existing employees and new professional employees as the firm grows.

Approaches available to SME management in each category of the uncertainty management framework are as follows.

SME Agility

Agility is the core inherent strength of the SME. Rather than using this strength for sudden short term reaction the goal here is to exploit agility with a longer time horizon to buy time to survive.

Approaches available to SME management to manage uncertainty with SME agility are:

  • Fast opportunity exploitation – the ability to spot fast and shift quickly focus (pivot), resources, cash, and management attention to new opportunities.
  • Ability to say no to new opportunities to enable the firm to focus its constrained resources.
  • Maintain flexible people, organization structure, and processes.
  • Find and seize opportunities to improve efficiency to free up highly constrained cash to fast exploitation.
  • Fast time to market for new products and services – supported by fast experiments and rapid learning.
  • Exploration during seasonal low in annual cycle. Exploit in the rest of the year.
  • Nurture a culture of agility that avoids status symbols, building a hierarchy, transparency of information, and performance over founding employee tenure.
  • Preserving staff rather than cost cutting and emphasize hiring flexible staff.
  • If able to acquire, buy new businesses not mature businesses.

SME Absorption

Although the SME does not have the resources of a large business there are approaches that enable management to buy time until generating cash from fast opportunity exploitation which are:

  • Maintain low fixed costs in core operations to minimize cash drain from a sudden VUCA crisis.
  • Build a war chest even if it is not large to fund fast opportunity exploration.
  • Customer lock-in from high switching costs in profitable core to buy time.
  • Seek protected core markets as much as possible leveraging personal relationships.
  • Seek powerful patron with vested interest in the success of the SME such as a customer or investor.
  • Categorize and differentiate ‘good fat’ and ‘bad fat’ to support modest cost reduction of ‘bad fat’ first. Spend time with staff defining what these two categories mean. Engage staff eliminating ‘bad fat’. Cut ‘good fat’ as a last resort.

Coincidence of Owner Power in SMEs

Before looking at the remaining four components of the uncertainty management model it is important to look at the coincidence of owner power present in many SMEs as this can harm the ability of the firm to withstand a market VUCA crisis.

The higher coincidence of power resting with owner of a SME rather than a corporate board presents the most difficult challenge for managing a market VUCA crisis. The Greiner growth phase crisis model suggests that smaller/younger firms can pass through several crises in the early stages related to crisis of leadership, autonomy, and control as the firm becomes too large for the owner to personally direct. These are internally focused crises and key crucible milestones for the SME.

Assuming the ambition of the owner remains growth as opposed to a lifestyle preference a market VUCA crisis creates a life or death decision point for the owner putting their personal preferences in direct conflict with the long term survival of the firm. Faced with a VUCA threat to the core business the owner themselves may become the problem and must recognize that they need to loosen control of decision making and involve SME management and staff more in decisions impacting the firm. Owners need to consider if their personal preferences are harming the ability of the SME to prepare for a market VUCA crisis.

Navigational Leadership for SMEs

Market VUCA can create strong anxiety and fear in the workforce particularly in SMEs who are more exposed. Although employees working in SMEs are more resilient to survival stress management must still display confidence and optimism moving forward through a clear vision and goals. VUCA can sap morale and energy.

Key methods to enable navigational leadership for SME include:

  • See a VUCA crises as an opportunity.
  • Inspire confidence by making sense of the external environment, explain why action is needed, and articulate a clear vision.
  • Maintain speedy decision making process and avoid centralized control. Owners need to give up decision making power. Engage staff in determining how the firm will move towards clear vision.
  • Make allowances for course corrections in the vision because not everything will be known in the presence of VUCA.
  • Keep staff focused on the new mission.
  • Establish a diverse and collaborative mindset in the growing SME culture.

Strategic Anticipation for SMEs

SME management needs to make thoughtful choices in spite of VUCA, assess alternate scenarios, consider implications, and prepare accordingly.

Key approaches to enable strategic anticipation for SMEs include:

  • Avoid becoming internally focused as the firm grows and more institutionalized – always stay external focused as formal processes are established but ensure continuous improvement embedded in the culture.
  • Just In Time Approach to strategy setting, risk taking, and resource allocation that support agility.
  • Develop the ability to do fast option evaluation with informed go/kill/hold decision making.
  • Need to constantly question the assumptions of the business (Drucker) including: assumptions about the environment in particular (society, structure, market, customer, technology); assumptions about the SME’s mission; and assumptions about the core competencies needed to accomplish the SME’s mission. I would add assumptions about the owner’s preferences as the elephant in the room that needs to be addressed hastening resolution of the crisis of control in Greiner’s model.

Open Collaboration for SMEs

The connection of the SME with the outside world is highly influenced by the personal relationships of the owner with customers. Open collaboration in large firms is about breaking down the walls of the organization and connecting with the external market. In the case of an SME open collaboration is about moving beyond the personal relationships of the owner. Collaboration in this case is a means to adapt for the firm to survive in the long term. The goal is spot shifts sooner in core markets and avoid owner’s blind spots. Owners again need to self reflect and decide if they are a barrier to open collaboration and the firm moving towards thinking as a “collective brain”.

Key approaches to enable open collaboration for SMEs include:

  • Develop a collaborative mindset throughout the organization – open to new ways of thinking, new ways of drawing in knowledge and insight.
  • Developing sources of new ideas by crossing industry borders, government organizations, strategic suppliers, and partners and getting beyond geographical borders.
  • Considering ideas from other industries is particularly important for SMEs.
  • Share information freely throughout the firm and avoid using information as a weapon.
  • Collaborate with customers through social media, co-creation, and crowd sourcing if appropriate.
  • Look for opportunities to make temporary alliances for shared resources (keep fixed costs down), joint activity, technology transfer, R&D consortia, industry standards groups, and innovation networks – reach out to universities for new ideas.

Predictive Learning for SMEs

Predictive learning provides the outside view to spot new opportunities to enable fast time to market. Being the first to “connect the dots” in a new way.

Key approaches to enable predictive learning for SMEs include:

  • Exploring customer problems more deeply looking for opportunities for new value creation.
  • Track trends in the market place.
  • Apply double loop learning which is to not just solve the problem but also open up thinking to modifying the goals of the firm to unlock new value creation.
  • Facilitate intrapreneurship within the firm – align intrapreneurship with navigational leadership.
  • Apply basic analytics and data mining of any data the SME has collected to date. Consider if data should be collected and tracked that is not at the moment.
  • Open the team’s mind with new ideas and foster discussions that challenge everyone’s mental models of the way the market is that may be constraining thinking.
  • Learn to act quickly on incomplete and ambiguous information.

SME management should consider how some of these uncertainty management approaches could be adopted by their firm. SME owners should reflect on how their personal preferences influence their decision making that may harm how a firm responds to a market VUCA crisis.

Managing Engineering WIP

Engineering work in process (WIP) is notoriously difficult to manage because unlike manufacturing WIP you can’t see it. Engineering WIP is information in various forms along the engineering value stream. Value is added to each ‘engineering work item’ at each successive stage up to customer delivery (either internal or external customers). The key goals are managing effectiveness and efficiency of engineering work. Typically management sees input requests and outputs that are often late and overrun but have trouble seeing the causes in-process. Management could take corrective action if they could see engineering in-process WIP more clearly.

Visualizing Engineering WIP

To visualize engineering WIP firms need to establish a simple system to identify ‘in-process engineering work items’ appropriate for each stage of their engineering value stream. These work items act as a proxies for physical items that would be visible in a manufacturing process for instance. Engineering work often varies in size, complexity, and novelty so a simple (ie. small-medium-big, low-medium-high, proven-modified-novel) rating system should also be used to differentiate the scope & nature of each work item without getting too confusing.

A visual WIP flow board should then be established to see where each work item rests on the engineering value stream as it flows along the engineering value stream as illustrated below:

Engineering WIP Flow Visualization

Post-it notes or total work item counts by size, complexity, or novelty identifiers are marked on a white board and updated weekly or at the operating cadence selected for the firm. Managers should distinguish between engineering work items that are ‘active‘ or ‘waiting in queue’. This distinction is critical to see queues, evaluate throughput, and identify capacity bottlenecks in the engineering value stream. The visual WIP flow board allows managers to see engineering WIP in-process and understand the dynamics of their resource allocation performance.

Queues in Engineering Work Flow

A key advantage of the visual WIP flow board is the ability to see where queues form in engineering as illustrated below:

Engineering WIP Constraints

All engineering managers have experienced the effects of queues but often can’t pin-point them with sufficient visibility in any given week to take effective action. Queues begin to form in any stage as capacity utilization increases beyond about 75-80% based on queuing theory (see Reinertsen for an in-depth explanation of why this is so). For example the production support stage in this example. Queues introduce congestion in the engineering work flow that causes delays that can lead to schedule overruns and idle engineers waiting for data in downstream stages.  Queues in earlier stages are more dangerous for engineering delivery performance.

The queue size – capacity utilization curve also helps to illustrate why maximizing capacity utilization in engineering is bad for schedule performance because in-process queue formation will choke flow.  Most firms today are multi-project organized by matrix so choked flow and congestion can have serious negative consequences from complex inter-project connections. The visual WIP flow board helps management to make the paradigm shift from the traditional ‘maximize utilization‘ paradigm to ‘maximize throughput’ paradigm of lean engineering. Probably the single biggest benefit of the visual WIP flow board is being able to see queues forming before they reach choke flow in order to take timely action. This is also why the visual WIP flow board should be updated weekly at a minimum to capture the dynamics of work flow in engineering.

Engineering WIP Capacity Constraints

To maintain streamlined flow , maximize engineering work efficiency, and avoid congestion/choked flow the amount of WIP in each stage of the engineering value stream should be actively managed. This is accomplished by applying WIP capacity constraints at each stage of the engineering value stream. For example the capacity constraints are defined in the shaded middle row of the visual WIP flow board for each stage of the engineering value stream.

WIP capacity constraints enable engineering managers to control the throughput in engineering. The visual WIP flow board helps to visualize the flow on a day-to-day basis enabling more effective control actions.  When combined with small batch sizes WIP capacity constraints are powerful management control methods. Engineering managers can adjust and set the optimum WIP capacity constraints as they gain experience with the visual tool in practice.

Engineering Throughput Management Levers

How can managers use the visual WIP flow board in practice to take corrective-action? Several management control options or responsive levers are now possible with visual WIP flow board:

  • Work Acceptance Discipline – This is the most critical lever because WIP constraints at the initial stages can ‘throttle‘ the work flow in down stream processes. If too much work is accepted in a short period of time the work the visual WIP flow board illustrates how streamlined flow would become rapidly choked and slow progress along the value stream with waves of underutilization at later stages. By applying ‘go/hold discipline’ management can set engineering up for success along the engineering value stream.
  • Resource Allocation – The visual WIP flow board also helps to see how engineering resources should be allocated to deliver value at each stage. The visual tool inherently allows multi-projects but rather than giving a project view gives a resource view to clearly see capacity constraints for faster resolutions.
  • Resource Organization – The visual WIP flow board provides insight into how engineering resources should be organized to maintain streamlined flow.  The value stream model provides an alternate view of the functional-project ownership problem that many organizations get caught in. Firms may have several business lines that possess separate value streams so managers can identify bottlenecks and allocate resource capacity more effectively to each value stream rather than function or too many projects.
  • Allocating Spare Capacity – Engineering resources that are underutilized will be immediately clear from the visual WIP flow board enabling engineering managers to reallocate their time for short periods to work down queues in other stages. Developing flexible resources is key. Some specialist engineers may be more difficult to move but the visual board helps staff to see how their flexibility will help contribute to the firm business performance but also make their work day less stressful.
  • Targeting Outsourcing / Subcontractors – Stages with perpetual queues are opportunities to target outsourcing or subcontractor efforts. The added overhead and lead time for outsourcing is not appropriate for short term queues and will not be responsive enough to maintain streamlined flow.
  • Engineering Process Improvements – Stages with perpetual queues are also ideal opportunities to target engineering process improvements.
  • Adjusting To Seasonal / Cyclical Variation – By tracking and recording engineering throughput data collected with the visual WIP flow board on a weekly tempo over an annual period management can build better insight into seasonal and cyclical variation. This insight can be useful to resource capacity actions, work acceptance decisions, and outsourcing decisions. All firms experience some form of seasonal work volume effects so the visual WIP flow board can be used to manage short term surges at peak work volumes or scheduling long term development activities during slow periods.
  • Efficient Buffers For Variance & Uncertainty – High task duration variance caused by uncertainty during the ‘fuzzy front end’ of the engineering value stream is key operational difference from manufacturing value streams. Although active risk management and risk reduction methods can be applied to reduce the variation eliminating it outright is not possible nor desirable because it inhibits innovation a key source of value creation. The visual WIP flow board enables engineering management to intentionally build-in capacity buffers to increase throughput.
  • Business Line Value Streams – As firm’s grow and support multiple business lines separate visual WIP flow boards can be established to support resource allocation across the multiple business lines to enable prioritization, de-confliction, and possibly even exploiting differing seasonal cycles for efficiency.

Combined together the visual WIP flow board and active WIP management can dramatically improve engineering efficiency and effectiveness. The improved control realized by such a method can dramatically improve project on-time and on-budget outcomes.

Strategically the visual WIP flow board can also help management to make wise resource investments, partnering decisions, and strategic pivots to fuel growth. Experience with the visual WIP flow board provides management a better feel of how to size and allocate new engineering resources if the firm is growing rapidly. The mix of experience and inexperience can be targeted to stages that present the biggest bottlenecks to growth. Alopex Management Consulting can assist you to implement more effective engineering WIP management for improved business outcomes.

Innovation Investment Behaviour by Large (>$100M) Firms

Insight into the innovation investment behaviour by large (>$100M) firms was recently revealed in a report by Accenture who surveyed 519 firms in US, UK, and France representing Banking, Capital, Retail, Electronics, High Tech, Health Providers, and Consumer Goods & Services. Data was provided comparing innovation performance in 2009 with data from 2012.

Important observations from 2012 were:

  • Innovation as a Strategy – Fully 70% of the firms responded that innovation was one of their top 5 priorities with 18% being the top priority. 44% of manufacturers reported that innovation was extremely important to respond to “persistent change”. Only 34% firms believe they have a well defined innovation strategy in spite of 70% reporting that innovation was a top 5 priority.
  • Innovation Investment Mix / Emphasis – 48% new product or service, 26% new process or business model (down from 30% in 2009), and 24% improvement or modification of an existing service (up from 17% in 2009) leading to the conclusion that large firms are taking a more cautious approach to innovation than 2009.
  • Investment Levels – 51% firms responded that they increased funding devoted to new products and services with 74% of manufacturing firms increasing innovation investment levels.
  • Innovation Performance – Only 18% believe their innovation investments are delivering competitive advantage. Only half of management from the large firms feel their innovation system is effective. Better performance was achieved by firms with formal innovation systems in place with 51% of such firms being first-to-market as opposed to only 17% with those with no such system.
  • Innovation Shortfalls –  46% firms have become more risk adverse (shying away from breakthrough innovation and preferring incrementalism).  Firms with formal innovation systems tend to pursue breakthrough innovations more than incrementalism and report 50% more likely to see innovation deliver competitive advantage.
  • Challenges to Innovation – 30% firms noted predicting future trends as a challenge. 27% firms reported achieving cost containment as a challenge. 26% firms reported securing ongoing budget support as a challenge. 26% reported leveraging new technology as a challenge. 24% reported transforming new ideas into marketable products and services as a challenge.

Not reported though were growth performance over this period for firms with formal innovation systems to determine if such firms that have adopted innovation as a strategy are edging ahead of firms that have not. The data provide interesting benchmarks to compare with SMEs firm populations.

Innovation Diffusion From University R&D

R&D in Canada is conducted primarily in universities as opposed to industry. In fact Canada is an outlier in OECD countries in this respect. Canadian industry on the other hand is below average on R&D spending. This situation has created a significant up hill battle to move investments in university R&D to industry supply chains delaying economic benefits years into the future. Canada’s time to market performance commercializing new technology is far too long. Why is this and what are the implications for Canada?

Industry Supply Chain Innovation Diffusion

Outcomes from university R&D moves through two slow innovation diffusion processes: research commercialization (measured by Technology Readiness Levels); and industry supply chain adoption. Both innovation diffusion processes can be illustrated by this diagram:

Industry Cluster Innovation

From an industry supply chain perspective products purchased and used by consumers, businesses, or governments are sold by the Original Equipment Manufacturer (OEM) at the “system level” in the top right. Whether they be cars, aircraft, smart phones, refrigerators, the product is an assembly of parts purchased from a supply chain (into the diagram) and constructed in a unique way by the OEM to satisfy customer needs. The assembly of parts are based on building blocks starting with materials, components, subsystems, up to the complete system (seen as series of steps in the diagram). Software may be embedded at the component, subsystem, and/or system level. New technology can be leveraged for competitive advantage in all levels of the product hierarchy in an industry.

Industry Supply Chain Adoption

Product industries led by competing OEMs are supported by supply chains typically composed of four tiers below the OEM: Tier 1 major system integrators; Tier 2 components & sub assembly suppliers; Tier 3 machine shop service providers; and Tier 4 materials & special process service providers. Assembly and integration is performed at each level in a value adding process starting with basic materials. Examples of industry supply chains include aerospace, automotive, ships, and consumer electronics.

Product development, process/manufacturing development, and continuous improvement is performed at each level in support of business strategy and competitive forces. New technologies compete with existing proven technologies to demonstrate improved performance, quality, reduced cost, and time savings. Each tier therefore presents an adoption period before new technologies are accepted into high volume production and customer use. Customers in this case not only means the end user of the product but also each successive tier as the customer for the next lower tier. Supply chain adoption time is therefore based on development, sales, demonstration, and qualification, and experience from in-service use stages lasting 3-5 years at each tier on average although the adoption time can be much longer in conservative industries and shorter in hyper competitive industries.

Supply chains today are global with some national or regional industry clusters where local supply chains have agglomerated at several levels in the past. Canada’s industry supply chains are largely fractured except in certain industries where the country has invested heavily and developed world class “system level” product companies that can exert market pull to the develop local supply chain. Leading examples are Bombardier for commercial aircraft and rail or Blackberry for mobile devices. Unfortunately Canada also has difficulty maintaining a lead as world class “system level” product companies fall from grace such as Nortel or as Blackberry slips.

Research Commercialization

Any part that makes up the end product is based on existing technology with occasional introduction of new technology in hopes of achieving a competitive advantage. Improved product performance, quality, or cost can be achieved through technology advances for any tier in the supply chain. Firms at any level of the supply chain can secure sustained competitive advantage if they take steps to protect their new technology by patents.

Technology advances in Canada are primarily based on research conducted in universities and follows a long road to commercialization as it passes through a series of readiness levels such as the technology readiness level scale illustrated below:

Technology Readiness Levels

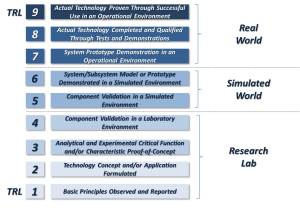
The technology readiness scale reflects the notion that the earlier stages are big “R” with small “d” with the emphasis moving to small “r” and big “D” in the latter stages. New technology is formulated and validated in the research lab before moving to prototyping in simulated environments and the real world.  Uncertainty and risk is reduced at each level until ultimately the technology is proven in the real world.

New technology can take 8-10 years to move through the technology readiness scale. Technology complexity and novelty can add time to this time delay. There are few short-cuts although firms that perform more of the steps internally have better control of the commercialization process, with fewer changes of hands, and achieve faster outcomes. Unfortunately the trend in most developed economies is that firms did perform much of the process internally are outsourcing the earlier research steps.

Research Commercialization Chasm

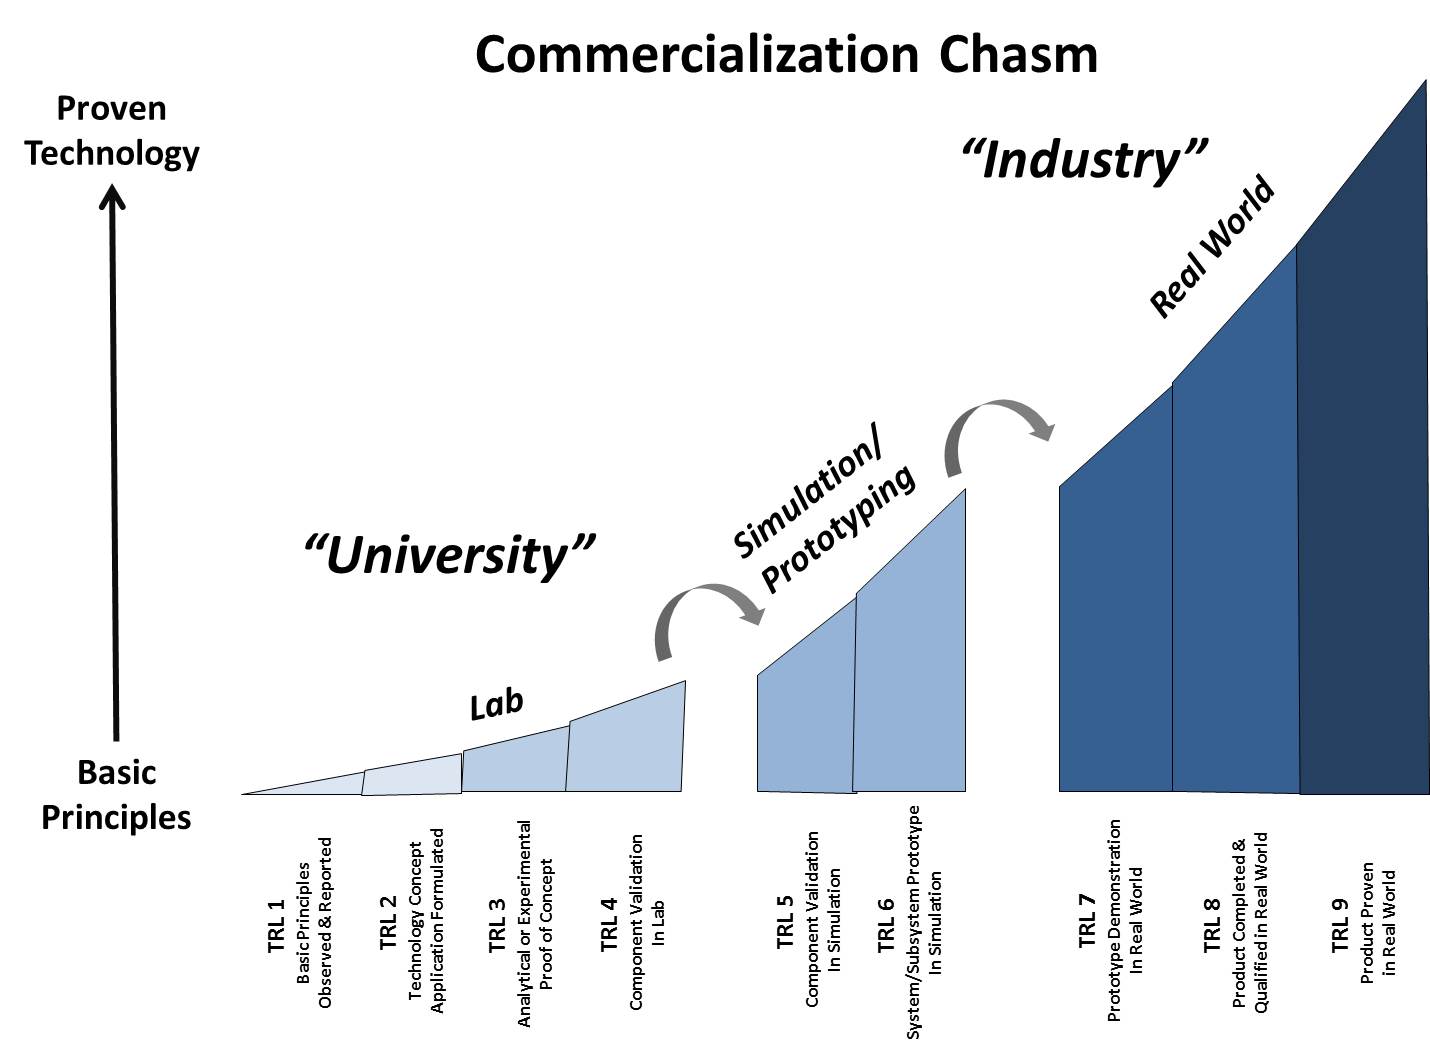
Lab researchers are unfortunately often far from the market pull of the product end user particularly in today’s global economic structure leading to a “commercialization chasm” as illustrated below:

Commercialization Chasm

University research focuses on lab work which is effective in bringing ideas to proof-of-concept stage. In today’s complex, fast changing world the jump to the real world is very large where lab prototypes are far from ready particularly for demanding operating environments or discerning/fickle consumer markets.

A key problem today is that Canadian universities are highly disconnected with industry except in a few rare cases. While geographic separation from Canadian industry clusters or international supply chains is a major source of commercialization delay the leading delay remains due to the commercialization chasm.

Implications For Canada

The implications of long diffusion time from university research commercialization and supply chain adoption are significant for Canada and the leading reasons behind the countries poor return on R&D investment. Should Canada’s economic growth begin to stagnate renewed focus on commercialization performance will take center stage as it is today in Europe and US.

As a resource based economy new technology in materials research is an obvious choice to drive growth. Unfortunately material research has the longest path to travel to commercialization because it must progress through both the technology maturity scale and be adopted by industry supply chains in Canadian clusters and global supply chains. The “bottom up” approach to commercialization will not yield timely return in investment to support economic growth.

A “top down” approach could be taken but Canada has few “system level” product world leaders to pull from Canada’s university R&D investments and bring alignment to fractured supply chains / clusters. While there is a strong desire for Canadian suppliers to access global supply chains a coherent and integrated industrial strategy amongst the levels of government and plethora of funding programs does not appear to exist. Canada’s small domestic market size and regional politics continue to hinder supply chain efficiency and effectiveness sufficient to align with a dispersed university R&D approach. Canada must get better at developing industrial strategy to maximize return on investments in developing competitive supply chains even if the top supply chain levels are foreign. The National Shipbuilding Procurement Strategy (NSPS) and national energy strategy debate are attempts at forming several new coherent and aligned strategies where none exist today but other industries would benefit such as agriculture, food processing, pharmaceuticals, medical devices, and clean energy. The importance of leveraging national industrial strategy to export trade for a country that depends on exports for its prosperity cannot afford to be lost in the regional political debate.

Canada’s university spin-off performance could be better. Simulation technology has advanced dramatically in recent years and pilot prototype facilities are increasingly available the cost for these stages are often not included in Canadian R&D funding programs. University spin-offs and start-ups often cannot obtain funding for these stages which is a leading reason underlying the “valley of death” barrier experienced by many Canadian start-ups.  This simulation/prototyping shortfall therefore presents a major barrier or “commercialization chasm” further delaying adoption by industry supply chains. Recent restructuring and repurposing of Canada’s National Research Council is directed at solving this problem but Canada remains weak in developing clear industry strategy to align all the players for better economic outcomes.