Monthly Archives: October 2013

Future of Engineering Education

How engineer’s are educated in an increasingly complex world is of great importance to developing nations. STEM participation rates are also dropping which will have a big impact on their future competitiveness. Education budgets are under pressure as funds are being directed towards supporting an aging population. At MIT’s Sociotechnical Systems Research Center (SSRC) Professor Daniel Hastings, the Cecil and Ida Green Education Professor of Aeronautics and Astronautics and Engineering Systems at MIT, recently presented Beyond The Engineer of 2020 giving his views on the past, present, and future directions of engineering education in the US which is largely applicable to all developed countries.

Specialism vs Systems Holistic Thinking

The biggest challenge for educating future engineers in a world with rapidly expanding knowledge, complexity, and uncertainty is balancing the tendency to focus in narrower specialty engineering disciplines while still maintaining the a practical understanding of the ‘big picture’ system in a real world context – the “T” shaped person. Industry requires “T” shaped engineers to sustain competitive advantage.  In support of this trend Hastings’ described that the attributes of future engineers should include:

  • Strong analytical skills
  • Practical ingenuity and creativity
  • Good communication skills
  • Business management and leadership skills
  • High ethical standards, professionalism
  • Dynamic, agile, resilient, flexible
  • Lifelong learner
  • Able to put problems in their socio-technical and operational context

Engineering programs are constrained in time, cost, and faculty experience so fully developing a “T” shaped engineer has and will continue to be challenging in a four-year degree without fundamental change. Hastings provides several examples of how change is being implemented at several US universities.  Hastings also described recent recommendations to: introduce engineering students to the iterative design-build-test paradigm earlier in the program (think Lean Startup); hire more industry experienced faculty; and professionally develop existing faculty.

Hastings’ diagram of skills-attitudes-knowledge capture very well how modern engineering education has moved away from skills based practical application to knowledge or science based emphasis degrading most new entry engineer’s practical skills. The trend towards more research oriented universities has supported this trend and expanded the gap between engineering university programs and technical college programs who are much better prepared to enter the work force and be productive from day one.

New Learning Tools

The broad use of digital and mobile technologies has made the mankind’s collective knowledge available to everyone with an internet connection levelling the world’s playing field. The importance of on-line learning as an enabler of change is beginning to make impact.

Less structured and decentralized learning methods were recently explored by Joshua Davis in Wired magazine.  Davis observed that traditional school emphasis on reading, writing, and arithmetic was not preparing students for modern work that place high importance on developing teamwork, problem-solving, and interpersonal skills. Davis also observed that new teaching methods are oriented towards knowledge building from curiosity-fuelled exploration.

Hastings looked at the impact of on-line learning tools on engineering education in terms of rethinking the pedagogy of engineering education, opportunity to share knowledge world-wide, and opportunity to change the cost of engineering program delivery. Hastings observed that on-line education enables alternate pathways for student learning, modular learning packages that does not necessarily fit the semester structure, and increased interaction. He also talks about the seamless integration of learning from under grads to alums, blended education, and demand pull learning.

The importance of reading, writing, and arithmetic will never decline because cases of poor writing skills are well-known in most industries. The key challenge is how to efficiently and effectively develop a broader set of skills in the time and budget available and certainly on-line learning is clearly making this possible.

Gender Demographics Remains a Challenge

Finally, the continued  under representation of women in engineering remains a challenge. Hastings presents some interesting historical trend data (slides 48, 49, 55) suggesting the best ways to improve participation rates are: role models; summer programs; research experiences; professional development activities; academic support & social integration; and mentoring.

Budget pressure on education, global competition, and falling STEM participation rates suggests that engineering education is at a tipping point requiring faculty leadership to chart a radical new course for change based on new approaches, greater interdisciplinary collaboration, far greater industry collaboration, and balanced gender participation if new engineering graduates are to be properly prepared for an increasingly complex world.

Alberta Innovates 2013 nanoConnect Conference

Alberta’s nanotechnology industry participants came together for Alberta Innovates 2013 nanoConnect conference that explored nanotechnology opportunities emerging within Alberta. As a steering committee member of nanoMEMS Edmonton cluster from 2001-2007 I was curious to understand current developments and progress made since 2007.

Reflecting on the discussions I was pleased to see how the product development support infrastructure has matured and is now fully in place to help entrepreneurs productize their ideas – physically realize a product for field trials, early adopters, and limited product runs. The technical support infrastructure is based on $300M capability investment since the late-90s in Edmonton resident in NINT, University of Alberta nanoFab, ACAMP, and NAIT nanoCARTS with some capability resident in Calgary at the University of Calgary AMIF.

The creation of Alberta Innovates in 2010 consolidated multiple research programs into a coherent innovation system that builds on Alberta’s jurisdictional advantages in: energy, environment, agriculture, forestry, and healthcare. The logic as I understand it is that Alberta Innovates provides the platform for nanotechnology application commercialization building on these jurisdictional advantages. The current Alberta nanotechnology strategy guiding research and commercialization activities was released in 2007. The return on investment in terms of economic benefit from the $300M nanotechnology capability investments, R&D activity, and new venture investments though has still has not contributed to any perceivable growth in Alberta GDP so is beginning to come under some pressure to show results.

A consistent theme during the presentations and well articulated by Skip Rung from Oregon based ONAMI was the importance of three main building blocks: research; talent; and capital/business formation in order to see economic benefits of new technology.  I would add a fourth being the need for market development. Alberta’s nanotechnology industry is strong in the first two but struggling in the other two – capital/business formation and market. Although the end-to-end systems are in place to realize the product….business formation, customer development (in Alberta industries & global product markets), and market connections remain weak and immature.

The commercialization impediment of intellectual property stuck in universities (where most R&D tends to be invested in Canada) received some attention but other challenges to economic gain from Alberta nanotechnology investments remain:

  • Weak Demand Side Engagement – If commercial exploitation is being directed towards Alberta’s jurisdictional advantages then to move to the next level the Alberta nanotechnology industry needs much stronger and active demand side engagement from Alberta’s jurisdictional strength industries. Participation remains too heavily weighted towards the ‘bottoms-up’ supply side or ‘technology push’ oriented. Building strength from a strong domestic Alberta base is critical to economic success so where was the engagement from Alberta’s jurisdictional advantages? I have heard it said that industries don’t understand nanotechnology, how to use it, or what competitive benefits it brings.  The best example I have seen recently of senior executive participation was at the Cellulose Nanocrystal (CNC) pilot plant grand opening because of the burning need to find new applications for the forestry industry brought about by the decline in pulp & paper segment from the digital economy. More demand side ‘top-down’ engagement like the CNC pilot plant is needed.
  • Industry – Research Misalignment – Underlying the weak demand side engagement is the misalignment between research and industry. Canada’s heavy reliance on universities for R&D funded by federal and provincial governments and the misalignment with industrial needs is well-known. Refocusing resources in Alberta to leverage Alberta’s jurisdictional advantage is bringing alignment and clearly local start-ups who presented are pursuing industry problems which is much better than 6-7 years ago. We heard both sides of the ‘spin-off’ success debate but pressure is mounting to get universities aligned with industry needs.
  • Industry Receptors – The structure of industries (size, ownership, head office location) exploiting Alberta’s jurisdictional advantages are holding back demand side engagement and industry – research alignment. Although energy, petrochemical, and forestry have larger Alberta based businesses that conduct R&D in Alberta the agricultural sector is a diffuse collection of SMEs.  Environmental and healthcare sectors are very young composed of start-ups or small businesses.  The environmental sector benefits from strong energy industry support and investments. There are no large healthcare firms headquartered or with large operating divisions in Alberta.  BioAlberta is the main cross sector voice for the nascent advanced technology growth with Agriculture, healthcare, and biological based environmental industry.
  • New Venture Financing – After experiencing the ‘valley of death’ in a molecular diagnostic medical device start-up in Edmonton the issue of poor new venture financing in Alberta (and Canada) remains a problem. The Alberta Enterprise Corporation was formed in 2009 to inject funds into venture funds but there was no evidence during this conference that this initiative has made any impact in support of commercializing the province’s nanotechnology investments. The AEC 2012 deal flow study determined that nanotechnology (combined with aerospace & robotics) only comprise 2% of the Alberta sector venture deals although the percentage is likely slightly higher in their data because of how they may have categorized embedded applications in life sciences, devices, materials, and chemicals applications.
  • Internal/Local Focus – As former Alberta based international vice president sales & marketing with experience in 25 countries and recently working in the UK for a year it is clear to me that the vast majority of Alberta are still too internally focussed. Whether due to a preference for life-style companies, lack of ambition, or lack of global business experience too few Alberta firms don’t take an external view.  Although Alberta is a land locked province, with no tidal ports, constrained international airline access, and not on major global trade-routes it is still possible to access global markets. The internal focus may also be due to Alberta’s jurisdictional advantages that are more commodity oriented with an over reliance on the US market rather than driven by-product/market choice growth strategy. Alberta is still a small market with only 4 million people so global markets for product companies are critical to growth and economic prosperity.
  • Lack of Urgency – Nanotechnology investments have not ignited economic growth – who is accountable for results and does this matter to anyone?  Saying that nanotechnology is not ready for commercialization is a way to take the pressure off but there are examples of MEMS and basic nanomaterials seeing commercial success. Our current resource wealth and prosperity means that we are not fighting for survival as Nava Swersky Sofer’s presentation on Israel very succinctly emphasized. Canada lacks natural enemies as our territory is largely not in dispute – Canadians are fortunate but should not be complacent in a rapidly changing world. The vast majority of Albertan’s really haven’t experienced a significant threat to our way of life other than the NEP.  Alberta is largely protected from world events and has only experienced localized or sector specific problems that in the aggregate not slowed growth such as: pipeline capacity limits, low natural gas prices, reduced pulp & paper, BSE hitting Alberta beef sales; or a strong Canadian dollar.  There is no sense of urgency driving nanotechnology commercialization.
  • Investment Dilution – Canada’s geography, large landmass area, and low population density will always be a challenge to focus enough critical mass to generate significant economic benefits that for example Finland has been able to achieve in Helsinki through Otaniemi as described by Ari Huczkowski. Clusters and creative cities matter. Rivalries and special interests will always work against critical mass in Canada. Edmonton has been fortunate to build critical mass on the supply side but lack or results is raising questions.

Solutions to improve economic outcomes from Alberta’s nanotechnology investments:

  1. Clear Grand Challenges – Dr Carlo Montemagno’s discussion of ‘grand challenges’ resonated with me as a means to align research-investments and build critical mass to improve commercial outcomes in Alberta. I did not see or hear a list of ‘grand challenges’ so this is worth building consensus across Alberta’s jurisdictional advantages.  A clear list of ‘grand challenges’ can serve to finally bring industry-research alignment, alignment with provincial priorities, and serve as a compass to guide wise investment decisions.   I also think it is worth distinguishing between solving ‘Alberta’s Grand Challenges’ such as environmental impacts of heavy oil and solving one or two of the ‘World’s Grand Challenges’ such as food and water supply constraints. In competing for limited funding resources which will take priority?
  2. Adopting a DARPA Approach to Commercializing ‘Grand Challenges’ – A prior post describes the basis for the approach. The Alberta nanotechnology industry needs some quick wins and a DARPA approach aligned behind the ‘Grand Challenge’ vision would help.
  3. More Senior Demand Side Participation – Future conferences require senior executive participation from industries representing Alberta’s jurisdictional advantage to be the voice of the customer to communicate ‘grand challenges’ – ‘can nanotechnology solve these industry challenges….’.  For example participation from COSIA made up of energy firms who are collaborating to address: tailings, water quality, and green house gas emissions.  Participants from agriculture, forestry, healthcare, and the environment.

Innovation Strategy

With the Harper government signing the Canada-EU Trade Agreement which is expected to come into force in a year or two Canadian business leaders are reminded to assess their current strategy in anticipation of increased competitive pressure.  A major free trade agreement such as CETA will change market competition by allowing new entrants into Canadian markets but also give Canadian firms improved access to foreign markets. Business leaders need to decide if they need to up their innovation game in response to increased rivalry.

Canadian business competitiveness has been falling behind in recent years traced to Canada’s lagging productivity compared to the US. Canada’s lagging productivity has been linked to Canadian business leader’s failure to adopt innovation as a strategy.

What are some innovation strategies and how can business leader’s select the right strategy for their industry/market?

Innovation Strategies

In their quest for above average industry profits business leaders can choose to find better ways to deliver their services or offer better products. The essence of innovation is in creating and capturing new value measured in terms of higher industry profits, improved growth, and strengthened competitiveness. Innovation can result from better products, processes, marketing methods, and business structures.

There are several categories for innovation strategies but I prefer the following:

  1. Do Nothing Innovation Strategy – Management decides that their existing assets and competencies are appropriate to achieve acceptable returns in their markets. These markets are often protected in some form so competitive intensity is low.
  2. Adapt / Adopt Innovation Strategy – Firm’s imitate innovative business practices or acquire ‘off the shelf’ solutions that incorporate new methods or technologies to improve returns or defend returns. Business practices could include copying processes, marketing methods, and business structures used by rivals or leading firms in other industries. Acquired innovations could be embedded within capital equipment, tools, information systems. Acquired innovations could also include licensed technologies or methods.
  3. Incremental Innovation Strategy – Incremental innovation involves making improvements to existing products and services in terms of the relevant performance, cost, & quality measures for the market.
  4. Transformational Innovation Strategy – Transformational innovation involves making a step-change improvement to a product or service far beyond what incremental innovation can achieve also measured in terms of the relevant performance, cost, & quality measures for the market. A transformational innovation could also be demonstrated in a completely different way of structuring a business or a different way of marketing.
  5. Breakthrough Innovation Strategy – A breakthrough innovation involves creating a new-to-the-world market for a product or service.

Firms can choose to adopt the ‘do nothing’ innovation strategy or one/several of the other strategies. Tactical actions and investments then follow the implementation of the selected innovation strategies.

Innovation Strategy Market/Industry Alignment

How aligned is your innovation strategy with your market/industry? Porter’s five force model of competition is the gold standard for assessing industry competitive intensity. Innovation strategies provide a means for firms to create barriers to entry, maintain an edge against substitute products, and differentiate products all to create value and capture profits in attractive markets. Generally speaking the choice of innovation strategy is in response to competitive intensity of the market and can illustrated with the following diagram:

Innovation Strategy Options

Although this diagram is simplistic it does help to make a gross strategic assessment whether the firm is investing enough in innovation to sustain company profits.  As competitive intensity increases businesses need to invest more and take more risk to survive and thrive. First movers can gain a temporary market advantage with higher profits with increasing magnitudes and durations for incremental, transformational, and breakthrough innovations.

Normal progress in industries can see adapt/adopt innovations become the necessary cost of entry for an industry rather than the source of differentiations. These industries drive industry participants to continually invest in innovation faster than some nominal rate of progress. A study by Curry & Clayton in 1992 revealed that the majority of Canadian firms employed an adapt/adopt innovation strategy. Benchmarking Canadian innovation performance with OECD peers since then has not demonstrated any improvement.

Business Leadership Behaviour

Are your risk tolerance and innovation investments enough to keep up? Canadian business leaders are known to be risk adverse and underinvest in R&D (a proxy for innovation). Canada’s small market size, distance from global trade routes, proximity mainly to the US, business preference to remain local, low ambition, and trade protections result in mainly low competitive intensity in Canadian markets. Canadian firms who choose to export face higher competitive intensity.   As globalization continues and trade barriers fall, new competitors will enter Canadian domestic markets and Canadian firms have the option of exporting more. Domestic and export competitive intensity will increase with the CETA and other trade agreements so business leaders need to decide if their traditional risk tolerance and R&D investment commitment will sustain their business in the face of this increased competitive intensity.

To evaluate their risk tolerance and level of sustaining R&D investments the industry competitive intensity diagram suggests that there is a minimum threshold necessary to survive for the current market competitive intensity. As competitive intensity increases the required level of risk tolerance and magnitude of sustaining R&D increases as illustrated below:

Innovation Strategy Risk Tolerance

Canadian businesses risk falling behind if they continue to be risk adverse and don’t spend enough on innovation to remain competitive with rivals.

Innovation Strategy Industry Change Alignment

How fast is your industry changing? The rate of industry change or industry dynamics provides insight into their time horizon to adopt innovation as a strategy. McGahan’s industry change diagram is useful to assess the magnitude of industry change and the degree of strategic response that may be required. The industry change model enables management to assess the degree of threat to the firm’s current core activities and core assets.

McGahans Industry Change Model

Normal progress is experienced in the progressive change box with neither core activities or core assets threatened because competitive intensity change is slow.  Adapt/adopt is often sufficient to survive in markets with progressive change. As industry change is directed towards improved processes and tools core activities and assets become threatened. The incremental innovation strategy is usually sufficient to remain competitive but management must take larger risks and invest more in R&D to keep up with the competition.  Radical change results if both the core activities and core assets of the firm are threatened such that the firm risks become obsolete rapidly. Transformative and disruptive innovation strategies are necessary to survive.

Canadian Industrial R&D Spending

Statistics Canada has released Industrial Research and Development: Intentions report summarizing R&D spending in Canada to 2013. The results echo the declining R&D investment trend reported in the Science, Technology, and Innovation Council 2012 State of the Nation report on Canada’s Science, Technology, and Innovation System report that has Canada falling from 16th of 41 countries in 2006, to 17th in 2008, and 23rd in 2011 in terms of gross domestic expenditure on R&D as a share of GDP. The Statistics Canada report results show industrial R&D in 2013 is anticipated to be down 2.8% from 2012 at $15.6B and remaining below the pre-recession peak of $16.8B in 2007.

R&D Spent By Size of Firm

These charts illustrate the % and amount of R&D (intramural R&D) spent by firm size (# employees) for 2007 to 2011 across all sectors from the Statistics Canada report.

Can R&D % Bar Chart

Can R&D % Line Chart

Can R&D $ Line Chart

Unfortunately the number of firms performing R&D by size was not provided to adjust these charts for this data set however the 2012 small business statistics reported that small businesses with 1-99 employees make up 98.2% of all firms, medium firms with 100-499 employees make up 1.6% of all firms, and large firms with greater than 500 employees make up 1.6% of all firms.

Strategies To Manage Uncertainty In R&D Projects

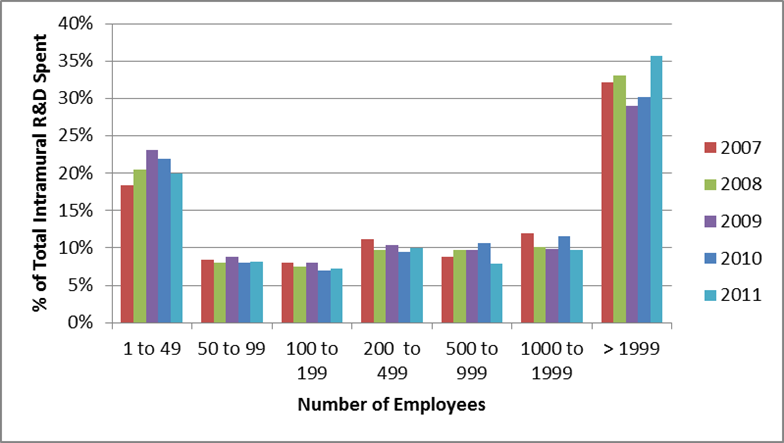
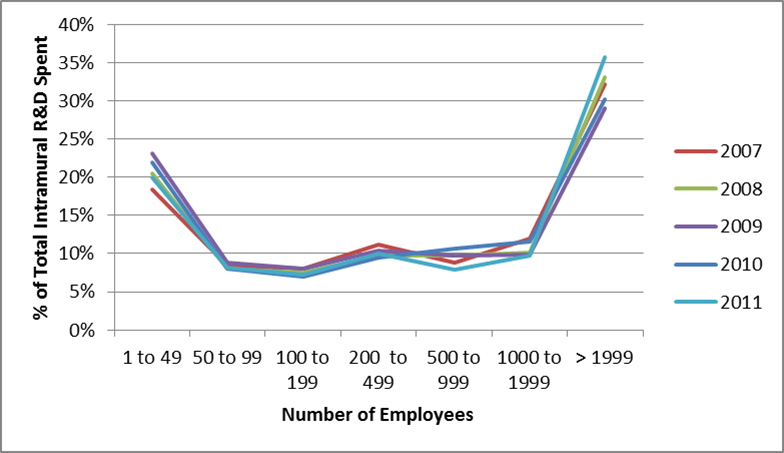
Canadian firms spend very little on R&D. Risk adversity is a leading reason for business leader’s preference for investing profits in M&A activities rather than growing the core through R&D, innovation, and new product development. R&D projects or projects with development work almost always suffer from schedule and cost overruns so business leaders avoid the trouble and invest profits in ways that they understand and feel are more predictable. The problem is that no new value is created and is quite often destroyed with M&A. Firms that can effectively manage uncertainty in R&D projects can achieve higher profits, growth, and improved competitiveness.

How can firms better manage uncertainty in R&D, new product development, and innovation?  The project constraint triangle is a helpful tool for R&D project managers to develop proactive strategies to manage uncertainty in R&D allowing business leaders to make wise investment decisions with effective risk mitigation and achieve their strategic business goals.

Product Development Project Constraint Triangle

The product development project constraint triangle helps to understand how to manage the impact of uncertainty in R&D projects, new product development, and innovation. The project constraint triangle is illustrated below:

Product Development Project Constraint Triangle

Most project managers understand this constraint triangle very well – project outcomes are constrained by scope, resources, and schedule.  Project outcomes are viewed simultaneously both externally, from the market’s perspective, and internally, from the firm’s perspective. The market wants value (performance, quality), at a good price, and when they need it. The firm wants profitable projects (efficient expenses) at acceptable risk leveraging their resources (core competencies in people, process, tools, and intellectual property).  Project managers continually trade-off cost and schedule to achieve project outcomes in normal projects with low to moderate risk in the application of normal project &risk management methods with schedule buffers and budget risk contingencies.

In the case of R&D projects, new product development, and innovation uncertainty and the resulting risk is much higher.  Development uncertainty occurs in scope with effects impacting schedule (schedule overruns) and resources (cost overruns). Firms with low risk tolerance usually stop here. The project constraint triangle though helps us to clarify management approaches for lowering uncertainty in R&D projects and insight into how firms can better manage uncertainty.

Uncertainty Management Strategies

The project constraint triangle define the trade-off space for project managers and reveals several strategies for managing uncertainty in R&D projects. The strategies are:

  1. Fix Resources + Fix Scope -> Vary Schedule
  2. Fix Scope + Fix Schedule -> Vary Resources
  3. Fix Schedule + Fix Resources -> Vary Scope
  4. If Able Contractual Relief Valves: Scope Relief, Schedule Relief, Resource Relief.

We often implicitly understand these alternatives but don’t explicitly state them nor proactively exploit them to their full potential for their improved business outcomes through better mitigation. Our business assumptions also can impede how we might exploit them to their full potential. We also need to consider the market context for how we might exploit these strategies in business-to-consumer, business-to-business, and business-to-government markets.

These strategies ultimately decide where the impact of uncertainty is absorbed in mitigation. This is the key to proactively managing the impact of uncertainty rather than just reacting too late.

Strategy #1: Fix Resources + Fix Scope -> Vary Schedule

This is the default strategy for most firms where uncertainty in R&D projects is absorbed when schedule buffers are exceeded by extending the schedule (ie. schedule overrun). The schedule overrun may then cause cost overruns from the continued involvement from the ‘standing army’ assigned to the project who must deliver the fixed scope beyond the budget risk contingency. Inexperienced firms fall into this trap and further reinforcing their risk adversity.

Resources are fixed in R&D projects because R&D staff are often constrained by the finite and limited number of internal staff with unique knowledge, skills, and experience and labour market constraints from engineering or specialist shortages. Cost savings by reducing R&D staff levels further constrains R&D project managers during difficult times.

Scope is fixed by the market requirements process leading to a product specification and customer needs definition.  Project planning processes require a precise scope definition to permit solution definition, estimation, and scheduling resources.

Implicit assumptions in this strategy are that R&D teams can’t find additional productive resources when needed to deliver the project and the project scope is sacred. When uncertainty arises we need to wait for our fixed resources to become available and if their work is on the project critical path a schedule delay results. R&D project managers often become the ‘scape goat’ when all available project buffers are gone.

Strategy #2: Fix Scope + Fix Schedule -> Vary Resources

This strategy is based on the assumptions that the scope can’t be changed and the project deliverables must meet a certain date. Uncertainty is absorbed by adding more resources and therefore cost to the project. Market driven firms in highly competitive industries are extremely sensitive to schedule so must fix the schedule so are more likely to adopt this strategy. Firms realize that they can’t go it alone to achieve their strategic goals.

Additional resources can be added by several methods:

  • Subcontracting R&D work packages to access productive resources with specialist knowledge.
  • Partnering with another firm with applicable core competencies.
  • Collaboration with university or R&D institutes to access resources.

The suitability of these approaches is determined by the project profitability (and profit sharing), responsiveness and alignment with other business entities, and understanding the critical path of the R&D project schedule. Internal resistance often impedes outsourcing R&D as does the ‘not designed here’ behaviour driven by the belief that specialist knowledge does not exist in other firms.

Strategy #3: Fix Schedule + Fix Resources -> Vary Scope

This strategy is based on challenging the assumption that scope can’t be changed. The schedule date is fixed and limited R&D resources are fixed so uncertainty is absorbed by backing off of the scope promises tied to where uncertainty is impacting the project critical path.

Scope reduction methods that can absorb the impact of uncertainty are:

  • Minimum viable product approaches.
  • Spiral product development approaches that offer future upgrades based on solutions to uncertain elements of the product concept.
  • Differentiating between must-haves and nice-to-haves.
  • Prepare upfront alternative ‘plan Bs’ for uncertain elements of the product.
  • Specify functions not solutions to provide technology trade-off spaces for design decisions.

Unfortunately R&D projects often get locked into contracts that drive precise scope definition without building in scope reduction mechanisms.  Firms become fixated on certain solutions and become blind to alternatives.  Firms also assume that customers won’t want a partial product even though the customers may not even be aware of the product concept.

Strategy #4: Contractual Relief Valves: Scope Relief, Schedule Relief, Resource Relief

In certain markets, such as government defence markets where novel scope is required, contractual relief valves are used.  Scope is also often added to defence contracts after contract award as security threats change in response to world events resulting in opportunities for schedule and cost relief.  Rarely is scope reduced to meet budget and schedule when uncertainty threatens to use up project buffers.

Contractual relief is also employed in business-to-business markets as customer needs change after contract award.  For consumer markets though contractual relief is not applicable requiring R&D project managers to proactively provide trade-off margins to work within the project constraint triangle long before market launch.

In a rapidly changing world relief valves are becoming increasingly important to build into R&D projects upfront in order to achieve business objectives.

Lessons For Proactive Management of Uncertainty in R&D Projects

How can we use the insight provided by the project constraint triangle to manage uncertainty in R&D projects better? Firms should develop a hybrid application of these strategies appropriate for your firm and your market and consider the following:

  • Draw out and challenge underlying assumptions influencing uncertainty mitigation methods in R&D projects in your firm. This may point to the need for broader cultural change as these may be deeply rooted in your employee’s underlying beliefs.
  • Build mechanisms for scope relief up front in the R&D project plan by recognizing that uncertainty may exceed original plan or the market may have changed since the project was started. Don’t default to strategies that default to absorbing uncertainty by schedule and cost overruns.
  • Adopt project risk management methods for novel projects.
  • Activities with high uncertainty need to be removed from the critical path of the project either through the solution choice or realistic technology road mapping that can underpin a spiral development path.
  • Higher percentage of reuse to achieve the scope. Focus new development areas that limits uncertainty to 10-20% and build in schedule buffers and risk contingency to fit the selected percentage.
  • Investment of time and effort to develop productive subcontractors well ahead of the R&D project because firms can’t go it alone in today’s markets. Invest in familiarizing them in your work processes, building personal connections with R&D staff to understand strengths, and improving communications.
  • Early development of partners with compatible strategies well ahead of the R&D project.
  • Building solution alternatives (plan B and C) to achieve the scope into the R&D project plan.
  • Early collaboration with university and R&D institutes off the critical path of the project.
  • Schedule buffers and budget risk contingency need to fit the level of uncertainty present in the project.

These approaches speak to the need for a broader and more holistic approach to how R&D, innovation, and new product development support your firm’s business strategy. Failing to develop partnerships and supplier relationships in advance doesn’t position R&D projects for success. Constraining the proportion of development activity to manageable levels while taking a longer term perspective also frees up R&D project managers to make effective trade-offs in the project constraint triangle. Experienced firms tend to understand these trade-offs better and build these strategies into their R&D, new product development, and innovation investments.

Canadian SME Growth Numbers

The annual Canadian Small business statistics for 2012 were recently published by Industry Canada. In 2012 Small business (1-99 staff) made up 98.2% of all firms, medium firms (100-499 staff) made up 1.6% of all firms with the remainder large firms (>500 staff). Looking at high growth SME statistics, innovation, and export activity which reflect small business growth performance some of the main results are summarized.

High Growth SMEs

The highest concentrations of high growth SMEs (Annualized growth rate > 20%, over a three year period, with 10 or more employees) between 2006-2009 were:

  • Construction (4.9% of all firms).
  • Business, building, and other support services (4.6% of all firms).
  • Professional, scientific and technical services (4.5% of all firms).
  • 7.4% of service producing SMEs expect to grow more than 20% and 13.7% grow 11-20% between 2012-2014.
  • 9.0% of manufacturing SMEs expect to grow more than 20% and 19% grow 11-20% between 2012-2014.
  • Observation was made that high growth firms are not restricted to high technology firms.

Innovation

In terms of innovation:

  • In 2009 small businesses performed 31% of R&D ($4.8B), 18% medium firms performed R&D ($2.8B), and 51% of large firms performed R&D ($7.7B).
  • Between 2009-2011 SMEs that innovated between 2009-2001 were found in manufacturing (58.1%), knowledge-based industries (50%), and professional, scientific, and technical services (43.5%).
  • 38% of small businesses and 56% of medium business made at least one innovation between 2009 and 2011.

Exports

In terms of export activity in 2011:

  • 90% of exporters were small businesses (compared with 85% in 2008) but only 10.2% small firms exported.
  • 34.4% medium firms exported.
  • Total exports were $374B (increasing $48B over 2010) with 23.9% by small firms, 16.2% medium firms, and 59.9% large firms.
  • Exports account for 30% of GDP down from 34% prior to 2008 and has not reached pre-recession levels yet.
  • SME export destinations were US (89.3%), Europe (32.1%), Latin America (11.9%), China (11.6%), Other Asia (11.6%), and Others (15.4%).

Regulatory Burden On SMEs

The cost of regulatory compliance is often identified as an obstacle to innovation and growth such as was observed in the 2009 Industry Canada SIBS study. The Small Business Branch of Industry Canada recently shed further light on regulatory compliance cost issue in a small business regulatory compliance cost report.

Small Business Regulatory Compliance Cost Report Conclusions

The SBB study was based on a survey of  10,477 Canadian SME respondents in 2011 looking at the regulatory compliance costs from federal, provincial, and municipal regulations. The main conclusions were:

  1. Regulatory compliance cost was $4.76B in 2011 or $3,500 per business, $370 per employee, or 0.29% business sector revenues.
  2. The real cost of regulatory compliance decreased by 0.3% since 2005 as a share of economic resources.
  3. 6% of SMEs considered regulatory compliance to be a serious obstacle to success.
  4. 72% of SMEs did not even consider it to be a moderate obstacle to success.
  5. On average SMEs submit two government forms per month taking them on average 3 hours per month to complete or less than an hour per week.
  6. Firms consider paperwork to be the most time consuming with tax related requirements remaining the biggest challenge.
  7. Small businesses continue to bear a disproportionate share of the national burden of regulatory compliance and regulatory burden initially increases as a firm grows and hires employees before decreasing once economies of scale are reached.
  8. 65% of firms indicated cost of regulatory compliance was at an acceptable level in 2011 and 8.5% that cost was much higher than an acceptable level.

Compliance cost categories used were: payroll remittances; record of employment; T4 summary/Individual T4s; Workers Compensation Remittances; Workers Compensation Claims; Federal/Provincial Business Income Tax Filing; Federal/Provincial Sales Taxes; Corporate Tax Installments; Corporate Registration; Mandatory Statistics Canada Surveys; Municipal Operating Licences and Permits; Provincial Operating Licences and Permits; and Other Federal , Provincial, and Municipal Regulations.

Regulatory Issues Impeding Innovation

The regulatory compliance cost study is useful to understand the regulatory internal cost of taxation, permitting, and labour related regulations, particularly for labour intensive service industries, but really does not help to understand the market specific regulatory costs facing product/service SMEs that could impede innovation.

In terms of innovation, regulatory costs of certification, safety, and environmental compliance are not faced by most of these SMEs who are business-to-consumer and business-to-business service industries. The sectoral distribution of respondents were: 10.7% manufacturing; 19.5% retail trade; 45.7% professional, scientific, and technical servicers; 7.9% accommodation and food services; and 16.2% other services.  Potential high growth SMEs who would face market facing regulatory costs impeding innovation would fall within the manufacturing (10.7% of respondents) and possibly some percentage of the professional, scientific, and technical services (45.7% respondents) but even these are likely not end market facing.

Unfortunately the study did not look deep enough into innovation impeding market regulations or the impact were averaged out from the disproportionate number of service companies. The cost category ‘Other Federal, Provincial, and Municipal Regulations’ either does not appear in most tables of results or are a negligible amount of the total which may have been due to the survey structure.

The root cause of innovation impeding regulations are market segment specific (ie. air transportation, rail transportation, medical devices, personal telecommunications, etc) with complex interactions and market dynamics requiring a very different survey to the one prepared by SBB pertaining to the internal costs of taxation, permitting, and labour related regulations. Although useful, these internal regulatory costs are likely only a small portion of regulatory costs of market facing firms who adopt innovation as a strategy.

Canada Should Adopt The DARPA Model For Funding Key R&D

Canada, and other developed countries, need to improve their ability to drive prosperity through innovation yet this goal has been elusive. A recent article in Harvard Business Review “Special Forces” Innovation: How DARPA Attacks Problems written by Regina Dugan and Kaigham Gabriel provides some new insight into this problem and in particular how Stokes’ research model can help to make better R&D funding decisions.

Root Causes For Canada’s Poor Innovation Performance

There are many reasons cited for Canada’s poor innovation performance such as low competitive intensity due to the small population, low population density due to the large geographic area, low VC funding, risk aversion, lack of entrepreneurial spirit, and lack of ambition.

There is also no urgent necessity driving a need to innovate in corporate Canada. Experts often look at Finland’s commitment to an innovation-led economic strategy which ‘arose due to the severe economic crisis of 1991 and simultaneous impact of near collapse of the domestic banking system and massive export disruption du to the disintegration of the USSR’. Urgent necessity only exists in several localized areas: 1) youth who see lean software start-ups as their only choice for a good career, 2) clean tech for those who think that global warming is real.  Canada’s complacency stems from being a stable country, high wages, social safety net, stable food supply, affordable cost of living such that the majority of population are well off.  Also Canada came out of the financial crisis fairly well off. Canada also has no natural enemies to drive defence R&D similar to how the cold war fuelled Silicon Valley’s development before the emergence of venture capital funding.

Canada’s Approach to R&D

Another leading reason often cited for Canada’s poor innovation performance is the approach used to fund R&D does not lead to economic benefits. Canada is an outlier in several respects when it comes to how R&D is funded namely:

1) Due to the absence of many large firms, R&D funding is driven by the government and directed to universities who don’t have a good track record when it comes to commercialization of the R&D funding; and

2) R&D funding is provided to firms indirectly through R&D tax credits as opposed to direct funding.

Industry does not fund more R&D because 98% Canadian firms are SMEs who can’t afford to invest much in innovation.  Most Canadian SMEs have no ambition to grow being content with selling to their local markets. There are also a lack of mid sized firms in industries who could commercialize R&D being undertaken in Canadian universities. 527 mid-sized companies reportedly vanished between 2007 and 2010 representing a drop of 3.6 per cent compared with a rise of 2.6 per cent of the overall number of new Canadian firms according to numbers compiled by the Business Development Bank of Canada (BDC).

There is also a lack of industrial strategy aligned with Canada’s strengths and misalignment between business and universities. No sustained plan to target new emerging industries is evident and large research endeavours tend to lose focus and attention as multiple competing agenda’s erode economic exploitation. So it is difficult to build momentum with misalignment, lack of focus, bureaucratic complexity, geography, lack of large firms, etc.  My own study in Alberta’s innovation system revealed the lack of focus and low return on investment from R&D investments made in Alberta universities over the last decade.

Dugan and Gabriel’s paper use Stokes’ research model to explain DARPA’s success. Stokes’ research model is very useful to understand why Canada has not fully benefited from the significant investments in R&D spent at Canadian universities over the last 15 years.

Stokes’ Research Model

Princeton’s political scientist Donald E. Stokes proposed the following 2×2 diagram to categorize research and naming each quadrant with a leading historical researcher who exemplifies each approach:

Stokes Research Model

Each quadrant categorizes research by answering whether the research has practical use and whether it is a quest for fundamental understanding. The answers to these questions defines four categories:

  1. Pure Basic Research (Bohr Quadrant) – Curiosity driven research that is directed at seeking foundational knowledge without consideration of practical use characterized by the work of Niels Bohr.
  2. Pure Applied Research (Edison Quadrant) – Pure applied research that is directed at finding a solution to a real problem with no interest in explaining the underlying scientific phenomena characterized by the work of Thomas Edison.
  3. Use-Inspired Basic Research (Pasteur Quadrant) – Research that is directed at expanding basic scientific knowledge in order to meet pressing societal needs characterized by the work of Louis Pasteur. DARPA is a leading example of an organization that has adopted this type of research with results demonstrated by their achievements as described in Dugan and Gabriel’s article.
  4. Unnamed Quadrant – Research that is neither scientifically interesting or useful was left unnamed.

Stokes’ model suggests that Canada’s approach to R&D funding at universities tends towards Bohr’s quadrant which is not clearly driven by practical use – although eventually it may be commercialized it is not at the speed-to-market demonstrated by DARPA in Dugan and Gabriel’s article.

Reorienting Canada’s NRC

The Canadian federal government has begun to make changes by reorienting NRC to focus on commercialization and is working to consolidate the many government R&D funding programs. This is akin to emphasizing Pasteur quadrant research in the Stokes’ model.  Also the federal government is seeking to leverage defence procurement through key industrial capabilities for better economic outcomes. Although far from a DARPA model this approach is linking a need to the drive research.

While the government is moving the right direction there has been significant push-back from university researchers who feel that pure basic will be harmed by focusing more on commercialization. Ongoing pressure by the Alberta government to change the university research system to foster more commercialization is running into increasing resistance from academics. Unfortunately the government-university debate is highly emotive and often presented as a black or white, either-or type situation by the university researchers. The Stokes’ research model suggests that Canada could take a more holistic view of allocating research funds. The Stokes’ research model also provides a means to take a more balanced approach by establishing how university R&D research investments would be allocated between the three quadrants.

Recommendations

Viewing Canada’s poor innovation performance using Stokes’ research model suggests several recommendations:

  1. Canada needs more Pasteur quadrant research and bring clarity/balance to how R&D investments are allocated to each of the Pasteur, Bohr, and Edison quadrants.
  2. To implement recommendation 1 a balanced team of leading thinkers and public/industry engagement should create and prioritize a list of pressing needs whose solution would create economic benefits and national/societal good for Canada.
  3. National priorities and industrial strategies should be aligned as previously discussed on this blog.
  4. Several grand challenges (not solutions) be selected from this list that should receive significant funding employing a DARPA style approach.
  5. Innovation performance metrics that measure time to market should be incorporated into the current innovation scorecard that has deficiencies.
  6. Adopt the DARPA approach (described very well by Dugan and Gabriel) to achieve faster-time-to-market results for Canada’s pressing needs identified in recommendation 2.

In terms of a balanced portfolio of R&D investments in Canadian universities more work is needed to determine what the optimum balance should be between Pasteur, Bohr, and Edison quadrants.